
Earlier this year in July, we hosted the first ever Delhi useR meetup in collaboration with the Delhi useR Group and R Consortium. We also had a chance to host a member of R-Core, creator of the lattice package, professor Deepayan Sarkar from the Indian Statistical Institute. You can watch the talks from the last meetup on our YouTube channel here.
In Delhi, there are not many communities that bring together R practitioners and data enthusiasts working with R together. Delhi useR group started with an idea to facilitate collaboration and learning, as well as spur the adoption of R by the #rstats community in Delhi NCR. Last week, we hosted the December edition of the Delhi useR meetup and discussed geospatial visualizations using various R packages and cloud storage–based workflows in R.
Launch of flyio 🎉
In 2018, we were able to connect with our community more than ever before. From contributing three open-source projects within a year to hosting some of the most incredible groups, we have only grown and strengthened our mission to support the community. We have witnessed the power of collaboration and learning infused by communities such as Google Developers Group, PyData Delhi, WiMLDS (Women in Machine Learning and Data Science) and Elastic User Group among many others.
We recently made our third contribution to the open-source community with flyio, an R package that makes it possible to interact with data in the cloud (AWS S3, Google Cloud Storage, and local) directly using R. We were fortunate to be able to launch flyio with the group of R language enthusiasts who are doing some incredible work in data science — there couldn’t have been a better way!
You can learn more about flyio and its capabilities here, and follow the developments on Github here.
Basics of Shiny and Geospatial Visualizations
Sean Angiolillo, an independent researcher, talked about the basics of Shiny and geospatial visualizations. He also explained and discussed how he used Shiny to explore electricity, latrine and water access in India. From discussing the rationale for selecting the data set and how one might explore the visualization to exploring the mechanics behind creating the visualization in R, Sean’s talk covered it all.
Geospatial visualizations are an amazing source to map census data to geographical locations using various R packages like Shiny, leaflet, and sf. These libraries makes it relatively easy to build appealing interactive applications for exploring geospatial data. By layering variables over maps, it is easy to understand the correlation between datasets and actual geographical locations.
Shiny is an R package that makes it easy to build interactive web apps straight from R, and leaflet is one of the most popular open-source JavaScript libraries for interactive maps. You can follow Sean’s work on his blog here and connect with him on Twitter.
Up in the Air: Cloud Storage–Based Workflows in R
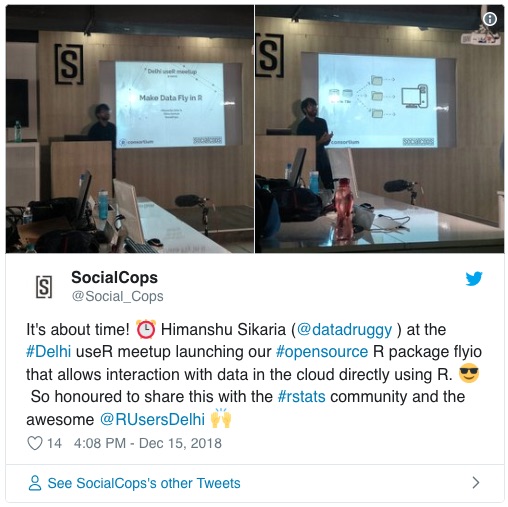
At Atlan, we use massive data from multiple sources. Cloud storage services like Amazon Web Service and Google Cloud Platform have come to our rescue and have proved to be a great support in helping us store data sizes that have now reached TBs. In this session by Himanshu from our team, he talks about cloud storage–based workflows in R, and our way of directly interacting with data stored in the cloud for our scripts without disrupting workflows.
He also launched flyio, an open-source R package that makes it possible to use a single way of data input and output. The session covered how flyio solves the problem of reading and writing data from Amazon S3, GCS or a local system with a single change in parameter, and how this has been super helpful and powers our data products.
You can access the presentation from Himanshu’s talk here, explore flyio here, and connect with him on Twitter.
Tweet about it, or it never happened! 🌍
And where is the fun if we don’t tweet about it? You can catch up on all the live updates and behind the scenes action on Twitter!
It was great to see #rstats and #datascience practitioners at @Social_Cops y’day for useR Delhi NCR #meetup #2.
Great sessions by @datadruggy and @seanangiolillo about #cloudstorage and #geospatial #visualization. Also, flyio #opensource 📦was released! pic.twitter.com/OseLYcqhab— R Users Delhi (@RUsersDelhi) December 16, 2018
You can reach out to the Delhi useR Group on Meetup here and if you are interested in getting involved, you can connect with our Community Team at [email protected].
The meetups are full of opportunities — learning, collaborating on projects and taking feedback on your work. It is always great to witness people coming from different backgrounds to share experiences, discuss ideas, and learn from each other — all for the R language that they are passionate about.


