
What if machines could learn?
This has been one of the most intriguing questions in science fiction and philosophy since the advent of machines. With modern technology, such questions are no longer bound to creative conjecture. Machine learning is all around us. From deciding which movie you might want to watch next on Netflix to predicting stock market trends, machine learning has a profound impact on how data is understood in the modern era.
This tutorial aims to give you an accessible introduction on how to use machine learning techniques for your projects and data sets. In just 20 minutes, you will learn how to use Python to apply different machine learning techniques — from decision trees to deep neural networks — to a sample data set. This is a practical, not a conceptual, introduction; to fully understand the capabilities of machine learning, I highly recommend that you seek out resources that explain the low-level implementations of these techniques.
Our sample data set: passengers of the RMS Titanic. We will use an open data set with data on the passengers aboard the infamous doomed sea voyage of 1912. By examining factors such as class, sex, and age, we will experiment with different machine learning algorithms and build a program that can predict whether a given passenger would have survived this disaster.
Setting Up Your Machine Learning Laboratory
The best way to learn about machine learning is to follow along with this tutorial on your computer. To do this, you will need to install a few software packages if you do not have them yet:
- Python (version 3.4.2 was used for this tutorial)
- SciPy Ecosystem (NumPy, SciPy, Pandas, IPython, matplotlib)
- SciKit-Learn
- TensorFlow
There are multiple ways to install each of these packages. I recommend using the “pip” Python package manager, which will allow you to simply run “pip3 install <packagename>” to install each of the dependencies.
For actually writing and running the code, I recommend using IPython (which will allow you to run modular blocks of code and immediately view the output values and data visualizations) along with the Jupyter Notebook as a graphical interface.
You will also need the Titanic data set that we will be analyzing. You can find it here.
With all of the dependencies installed, simply run “jupyter notebook” on the command line, from the same directory as the titanic3.xls file, and you will be ready to get started.
The Data at First Glance: Who Survived the Titanic and Why?
First, import the required Python dependencies.
Note: This tutorial was written using TensorFlow version 0.8.0. Newer versions of TensorFlow use different import statements and names. If you’re on a newer version of TensorFlow, check out this Github issue or the latest TensorFlow Learn documentation for the newest import statements.
Once we have read the spreadsheet file into a Pandas dataframe (imagine a hyperpowered Excel table), we can peek at the first five rows of data using the head() command.
The column heading variables have the following meanings:
- survival: Survival (0 = no; 1 = yes)
- class: Passenger class (1 = first; 2 = second; 3 = third)
- name: Name
- sex: Sex
- age: Age
- sibsp: Number of siblings/spouses aboard
- parch: Number of parents/children aboard
- ticket: Ticket number
- fare: Passenger fare
- cabin: Cabin
- embarked: Port of embarkation (C = Cherbourg; Q = Queenstown; S = Southampton)
- boat: Lifeboat (if survived)
- body: Body number (if did not survive and body was recovered)
Now that we have the data in a dataframe, we can begin an advanced analysis of the data using powerful single-line Pandas functions. First, let’s examine the overall chance of survival for a Titanic passenger.
The calculation shows that only 38% of the passengers survived. Not the best odds. The reason for this massive loss of life is that the Titanic was only carrying 20 lifeboats, which was not nearly enough for the 1,317 passengers and 885 crew members aboard. It seems unlikely that all of the passengers would have had equal chances at survival, so we will continue breaking down the data to examine the social dynamics that determined who got a place on a lifeboat and who did not.
Social classes were heavily stratified in the early twentieth century. This was especially true on the Titanic, where the luxurious first-class areas were completely off limits to the middle-class passengers in second class, and especially to those who carried a third class “economy price” ticket. To get a view into the composition of each class, we can group data by class, and view the averages for each column:
We can start drawing some interesting insights from this data. For instance, passengers in first class had a 62% chance of survival, compared to a 25.5% chance for those in 3rd class. Additionally, the lower classes generally consisted of younger people, and the ticket prices for first class were predictably much higher than those for second and third class. The average ticket price for first class (£87.5) is equivalent to $13,487 in 2016.
We can extend our statistical breakdown using the grouping function for both class and sex:
While the Titanic was sinking, the officers famously prioritized who was allowed in a lifeboat with the strict maritime tradition of evacuating women and children first. Our statistical results clearly reflect the first part of this policy as, across all classes, women were much more likely to survive than the men. We can also see that the women were younger than the men on average, were more likely to be traveling with family, and paid slightly more for their tickets.
The effectiveness of the second part of this “Women and children first” policy can be deduced by breaking down the survival rate by age.
Here we can see that children were indeed the most likely age group to survive, although this percentage was still tragically below 60%.
Why Machine Learning?
With analysis, we can draw some fairly straightforward conclusions from this data — being a woman, being in 1st class, and being a child were all factors that could boost your chances of survival during this disaster.
Let’s say we wanted to write a program to predict whether a given passenger would survive the disaster. This could be done through an elaborate system of nested if-else statements with some sort of weighted scoring system, but such a program would be long, tedious to write, difficult to generalize, and would require extensive fine tuning.
This is where machine learning comes in: we will build a program that learns from the sample data to predict whether a given passenger would survive.
Preparing The Data
Before we can feed our data set into a machine learning algorithm, we have to remove missing values and split it into training and test sets.
If we perform a count of each column, we will see that much of the data on certain fields is missing. Most machine learning algorithms will have a difficult time handling missing values, so we will need to make sure that each row has a value for each column.
Most of the rows are missing values for “boat” and “cabin”, so we will remove these columns from the data frame. A large number of rows are also missing the “home.dest” field; here we fill the missing values with “NA”. A significant number of rows are also missing an age value. We have seen above that age could have a significant effect on survival chances, so we will have to drop all of rows that are missing an age value. When we run the count command again, we can see that all remaining columns now contain the same number of values.
Now we need to format the remaining data in a way that our machine learning algorithms will accept.
The “sex” and “embarked” fields are both string values that correspond to categories (i.e “Male” and “Female”) so we will run each through a preprocessor. This preprocessor will convert these strings into integer keys, making it easier for the classification algorithms to find patterns. For instance, “Female” and “Male” will be converted to 0 and 1 respectively. The “name”, “ticket”, and “home.dest” columns consist of non-categorical string values. These are difficult to use in a classification algorithm, so we will drop them from the data set.
Next, we separate the data set into two arrays: “X” containing all of the values for each row besides “survived”, and “y” containing only the “survived” value for that row. The classification algorithms will compare the attribute values of “X” to the corresponding values of “y” to detect patterns in how different attributes values tend to affect the survival of a passenger.
Finally, we break the “X” and “y” array into two parts each — a training set and a testing set. We will feed the training set into the classification algorithm to form a trained model. Once the model is formed, we will use it to classify the testing set, allowing us to determine the accuracy of the model. Here we have have made a 20/80 split, such that 80% of the data set will be used for training and 20% will be used for testing.
Classification – The Fun Part
We will start off with a simple decision tree classifier. A decision tree examines one variable at a time, and splits into one of two branches based on the result of that value, at which point it does the same for the next variable. A fantastic visual explanation of how decision trees work can be found here.
This is what a trained decision tree for the Titanic data set looks like, if we set the maximum number of levels to 3:
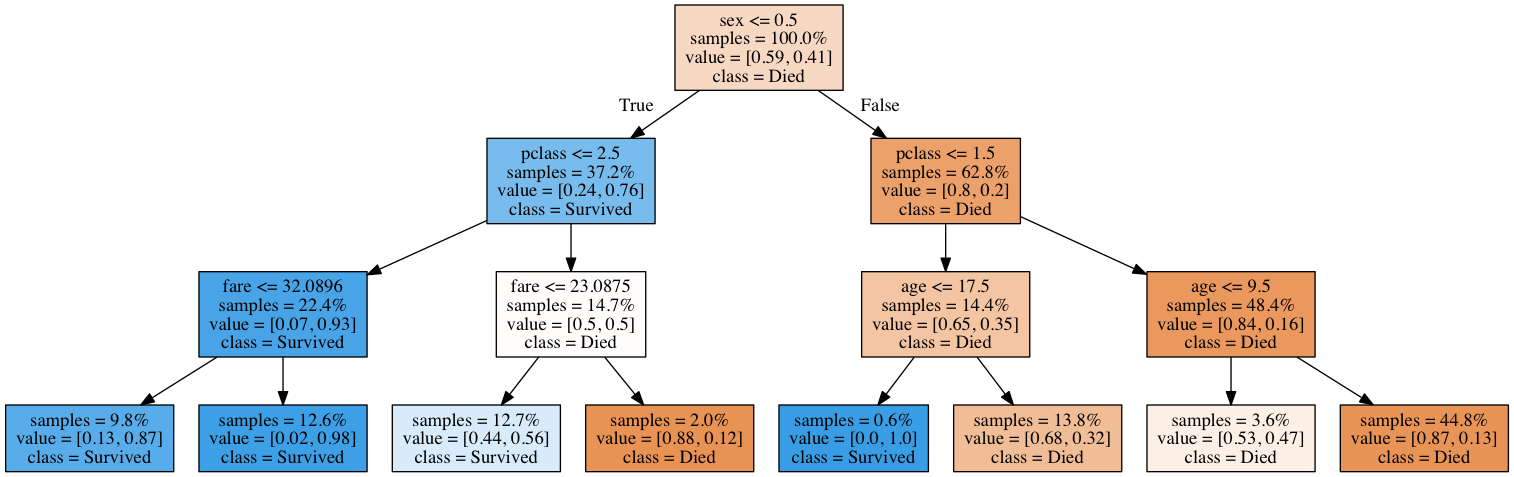
The tree first splits by sex, and then by class, since it has learned during the training phase that these are the two most important features for determining survival. The dark blue boxes indicate passengers who are likely to survive, and the dark orange boxes represent passengers who are almost certainly doomed. Interestingly, after splitting by class, the main deciding factor determining the survival of women is the ticket fare that they paid, while the deciding factor for men is their age (with children being much more likely to survive).
To create this tree, we first initialize an instance of an untrained decision tree classifier. (Here we will set the maximum depth of the tree to 10). Next we “fit” this classifier to our training set, enabling it to learn about how different factors affect the survivability of a passenger. Now that the decision tree is ready, we can “score” it using our test data to determine how accurate it is.
The resulting reading, 0.7703, means that the model correctly predicted the survival of 77% of the test set. Not bad for our first model!
If you are being an attentive, skeptical reader (as you should be), you might be thinking that the accuracy of the model could vary depending on which rows were selected for the training and test sets. We will get around this problem by using a shuffle validator.
This shuffle validator applies the same random 20:80 split as before, but this time it generates 20 unique permutations of this split. By passing this shuffle validator as a parameter to the “cross_val_score” function, we can score our classifier against each of the different splits, and compute the average accuracy and standard deviation from the results.
The result shows that our decision tree classifier has an overall accuracy of 77.34%, although it can go up to 80% and down to 75% depending on the training/test split. Using scikit-learn, we can easily test other machine learning algorithms using the exact same syntax.
The “Random Forest” classification algorithm will create a multitude of (generally very poor) trees for the data set using different random subsets of the input variables, and will return whichever prediction was returned by the most trees. This helps to avoid “overfitting”, a problem that occurs when a model is so tightly fitted to arbitrary correlations in the training data that it performs poorly on test data.
The “Gradient Boosting” classifier will generate many weak, shallow prediction trees and will combine, or “boost”, them into a strong model. This model performs very well on our data set, but has the drawback of being relatively slow and difficult to optimize, as the model construction happens sequentially so it cannot be parallelized.
A “Voting” classifier can be used to apply multiple conceptually divergent classification models to the same data set and will return the majority vote from all of the classifiers. For instance, if the gradient boosting classifier predicts that a passenger will not survive, but the decision tree and random forest classifiers predict that they will live, the voting classifier will chose the latter.
This has been a very brief and non-technical overview of each technique, so I encourage you to learn more about the mathematical implementations of all of these algorithms to obtain a deeper understanding of their relative strengths and weaknesses. Many more classification algorithms are available “out-of-the-box” in scikit-learn and can be explored here.
Computational Brains — An Introduction to Deep Neural Networks
Neural networks are a rapidly developing paradigm for information processing based loosely on how neurons in the brain processes information. A neural network consists of multiple layers of nodes, where each node performs a unit of computation and passes the result onto the next node. Multiple nodes can pass inputs to a single node and vice versa.
The neural network also contains a set of weights, which can be refined over time as the network learns from sample data. The weights are used to describe and refine the connection strengths between nodes. For instance, in our Titanic data set, node connections transmitting the passenger sex and class will likely be weighted very heavily, since these are important for determining the survival of a passenger.

A Deep Neural Network (DNN) is a neural network that works not just by passing data between nodes, but by passing data between layers of nodes. Each layer of nodes is able to aggregate and recombine the outputs from the previous layer, allowing the network to gradually piece together and make sense of unstructured data (such as an image). Such networks can also be heavily optimized due to their modular nature, allowing the operations of each node layer to be parallelized en masse across multiple CPUs and even GPUs.
We have barely begun to skim the surface of explaining neural networks. For a more in depth explanation of the inner workings of DNNs, this is a good resource.
This awesome tool allows you to visualize and modify an active deep neural network.
The major advantage of neural networks over traditional machine learning techniques is their ability to find patterns in unstructured data (such as images or natural language). Training a deep neural network on the Titanic data set is total overkill, but it’s a cool technology to work with, so we’re going to do it anyway.
An emerging powerhouse in programing neural networks is an open source library from Google called TensorFlow. This library is the foundation for many of the most recent advances in machine learning, such as being used to train computer programs to create unique works of music and visual art. The syntax for using TensorFlow is somewhat abstract, but there is a wrappercalled “skflow” in the TensorFlow package that allows us to build deep neural networks using the now-familiar scikit-learn syntax.
Above, we have written the code to build a deep neural network classifier. The “hidden units” of the classifier represent the neural layers we described earlier, with the corresponding numbers representing the size of each layer.
We can also define our own training model to pass to the TensorFlow estimator function (as seen above). Our defined model is very basic. For more advanced examples of how to work within this syntax, see the skflow documentation here.
Despite the increased power and lengthier runtime of these neural network models, you will notice that the accuracy is still about the same as what we achieved using more traditional tree-based methods. The main advantage of neural networks — unsupervised learning of unstructured data — doesn’t necessarily lend itself well to our Titanic data set, so this is not too surprising.
I still, however, think that running the passenger data of a 104-year-old shipwreck through a cutting-edge deep neural network is pretty cool.
These Are Not Just Data Points. They’re People.
Given that the accuracy for all of our models is maxing out around 80%, it will be interesting to look at specific passengers for whom these classification algorithms are incorrect.
The above code forms a test data set of the first 20 listed passengers for each class, and trains a deep neural network against the remaining data.
Once the model is trained we can use it to predict the survival of passengers in the test data set, and compare these to the known survival of each passenger using the original data set.
The above table shows all of the passengers in our test data set whose survival (or lack thereof) was incorrectly classified by the neural network model.
Sometimes when you are dealing the data sets like this, the human side of the story can get lost beneath the complicated math and statistical analysis. By examining passengers for whom our classification model was incorrect, we can begin to uncover some of the most fascinating, and sometimes tragic, stories of humans defying the odds.
For instance, the first three incorrectly classified passengers are all members of the Allison family, who perished even though the model predicted that they would survive. These first class passengers were very wealthy, as can be evidenced by their far-above-average ticket prices. For Betsy (25) and Loraine (2) in particular, not surviving is very surprising, considering that we found earlier that over 96% of first class women lived through the disaster.
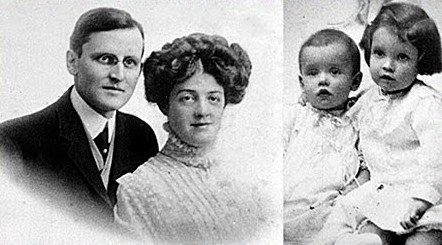
So what happened? A surprising amount of information on each Titanic passenger is available online; it turns out that the Allison family was unable to find their youngest son Trevor and was unwilling to evacuate the ship without him. Tragically, Trevor was already safe in a lifeboat with his nurse and was the only member of the Allison family to survive the sinking.
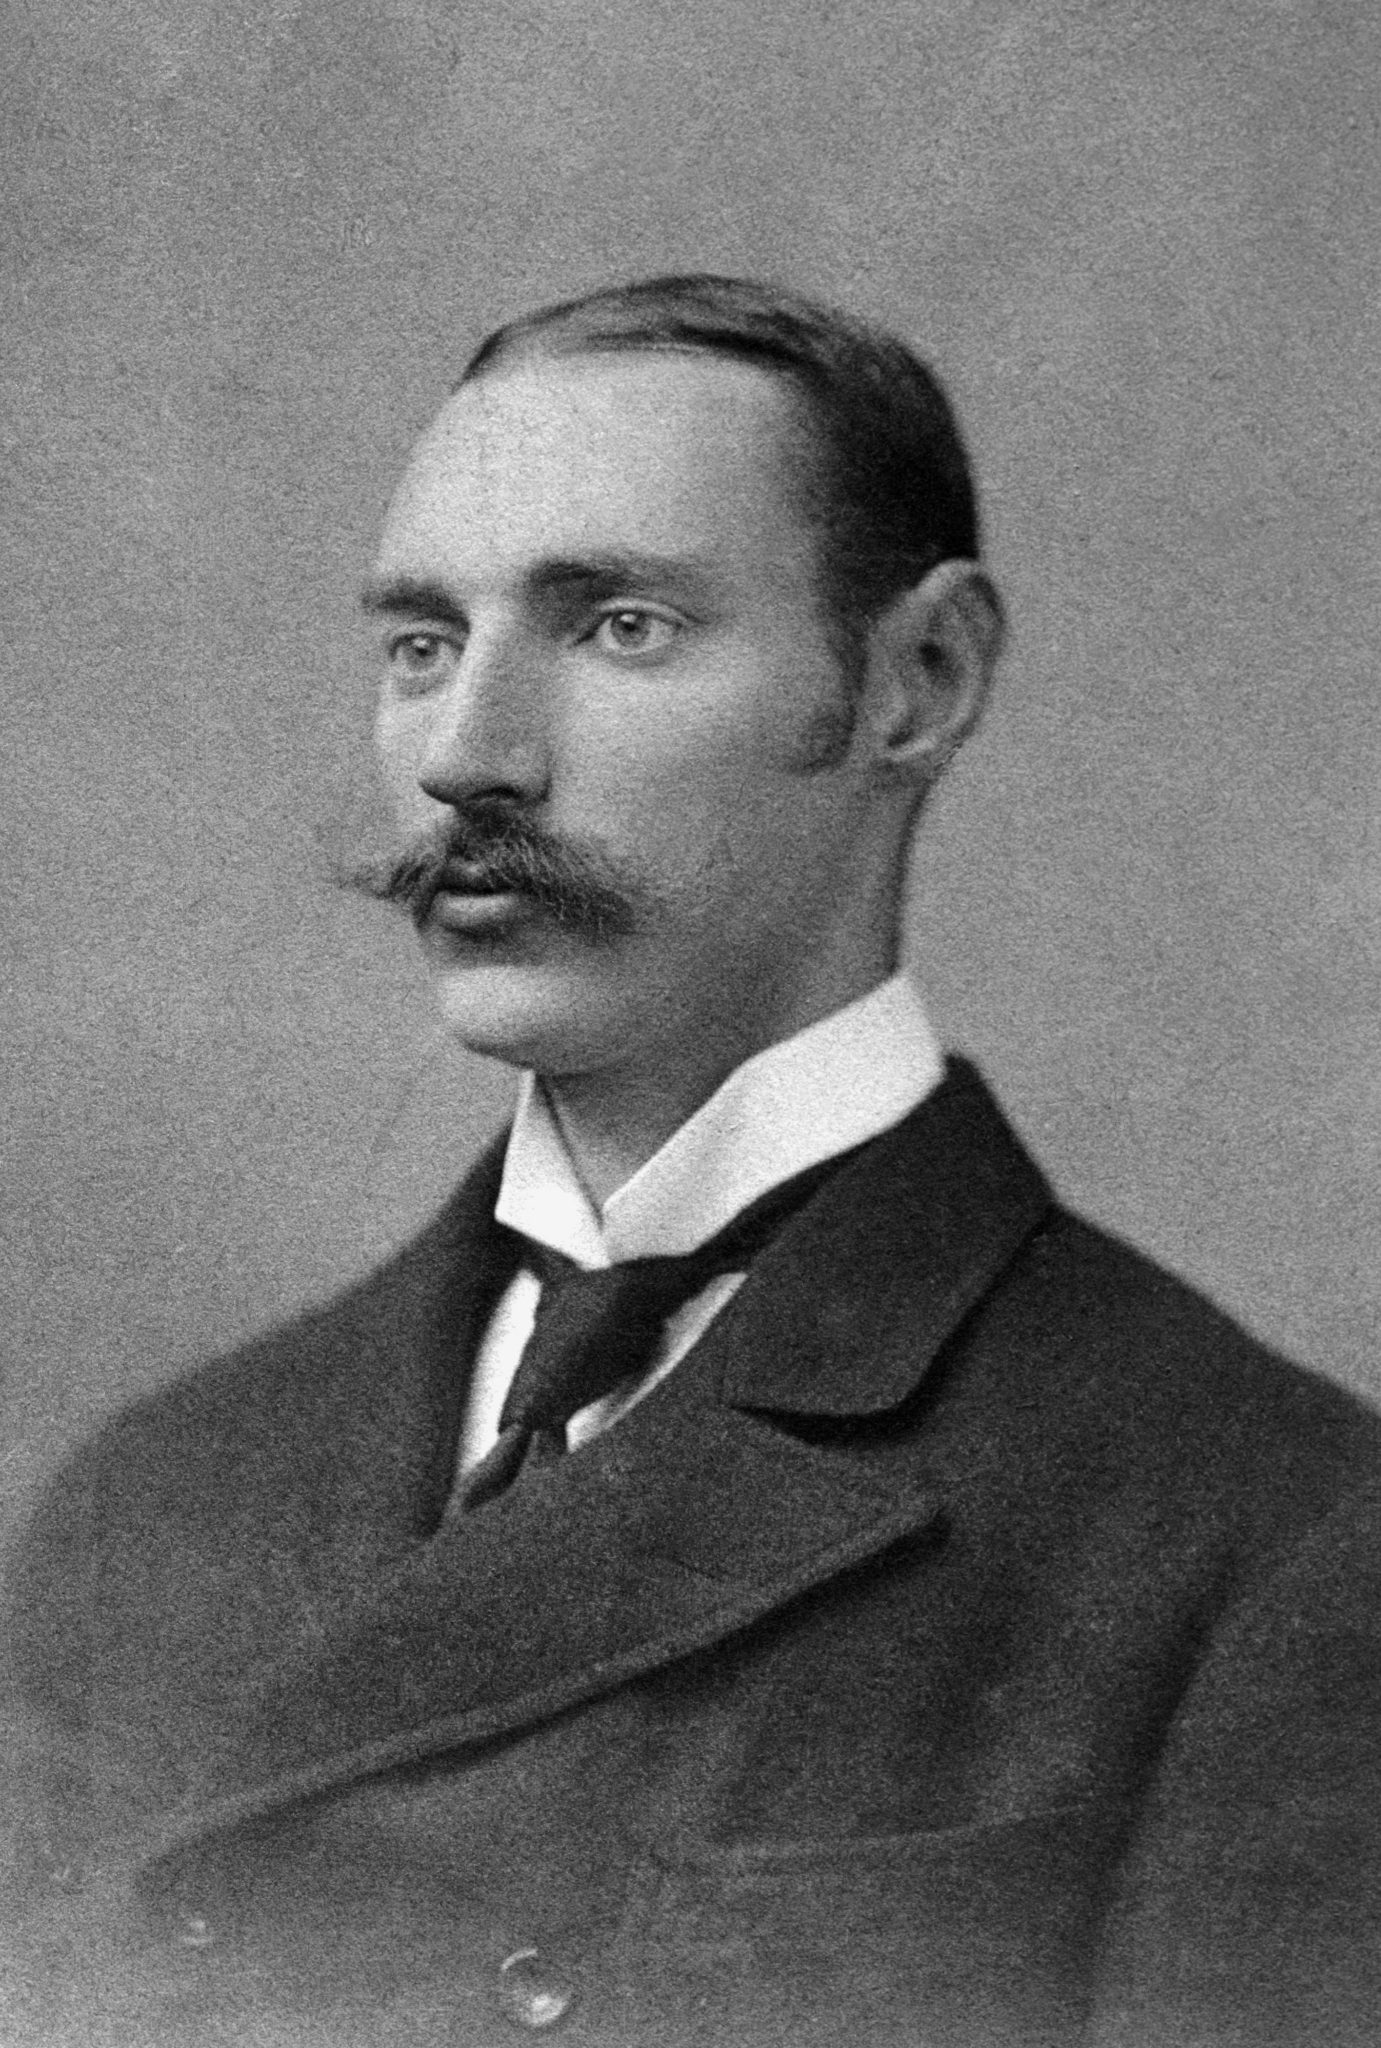
Another interesting misclassification is John Jacob Astor, who perished in the disaster even though the model predicted he would survive. Astor was the wealthiest person on the Titanic, an impressive feat on a ship full of multimillionaire industrialists, railroad tycoons, and aristocrats. Given his immense wealth and influence, which the model may have deduced from his ticket fare (valued at over $35,000 in 2016), it seems likely that he would have been among of the 35% of men in first class to survive. However, this was not the case: although his pregnant wife survived, John Jacob Astor’s body was recovered a week later, along with a gold watch, a diamond ring with three stones, and no less than $92,481 (2016 value) in cash.

On the other end of the spectrum is Olaus Jorgensen Abelseth, a 25-year-old Norwegian sailor. Abelseth, as a man in 3rd class, was not expected to survive by our classifier. Once the ship sank, however, he was able to stay alive by swimming for 20 minutes in the frigid North Atlantic water before joining other survivors on a waterlogged collapsible boat and rowing through the night. Abelseth got married three years later, settled down as a farmer in North Dakota, had 4 kids, and died in 1980 at the age of 94.
Initially I was disappointed by the accuracy of our machine learning models maxing out at about 80% for this data set. It’s easy to forget that these data points each represent real people, each of whom found themselves stuck on a sinking ship without enough lifeboats. When we looked into data points for which our model was wrong, we can uncover incredible stories of human nature driving people to defy their logical fate. It is important to never lose sight of the human element when analyzing this type of data set. This principle will be especially important going forward, as machine learning is increasingly applied to human data sets by organizations such as insurance companies, big banks, and law enforcement agencies.
What Next?
So there you have it — a primer for data analysis and machine learning in Python. From here, you can fine-tune the machine learning algorithms to achieve better accuracy on this data set, design your own neural networks using TensorFlow, discover more fascinating stories of passengers whose survival does not match the model, and apply all of these techniques to any other data set. (Check out this Game of Thrones data set.) When it comes to machine learning, the possibilities are endless and the opportunities are titanic.


33 Comments
amazing tips on how to carry out data analysis and machine learning procedures
Pingback: Linkdump #4 | WZB Data Science Blog
For some reason when i get to decision tree section, i get many errors on string conversion. eg.
clf_dt.fit (X_train, y_train)
ValueError: could not convert string to float: D
I’m using sklearn 0.17 on python 2.7.12
Any ideas?
The most likely reason for this error is that a string column in your processed dataframe is not being properly encoded, as the fitting algorithm does not work with string values (see the “Preparing The Data” section). Try running “processed_df.dtypes” on your dataframe, each of the columns should be either of the type “int64” or “float64”. If any of them are of a different type, double check your pre-processing code to make sure the problem-column is being either encoded or dropped.
Pingback: This Week in Big Data Analytics (Jul 10, 2016) - Big Data Analytics Guide
@NICK there is a chance you missed some lines of code following “titanic_df.count()”, make sure to scroll down and run the remaining part of that chunk. If that is not the case, then there must be another reason why you have string instead of numeric values in your training data set named X_train that is causing the problem.
Pingback: Would You Survive the Titanic? A Guide to Machine Learning in Python — Dr. Jonathan Jenkins, DBA, CSSBB, MSQA
Pingback: Would You Survive the Titanic? A Guide to Machine Learning in Python | Tech News
I’ve been told about this post by somebody who had read a post I had written on the use of MondoBrain for this same Titanic file. (see near the bottom of this page : http://www.mondobrain.com/business-cases.html)
The first concusion I drew was that rich people had fared better than poor ones and women than men. So I wondered who were the poor men who survived and who were the rich ones who died. For the latter you get : bachelors. That could explain John Jacob Astor and the norwegian : bachelors had to fend for themselves. (For the former : young kids with single parent.)
I didn’t know the Titanic crew was so chivalrous… (The conclusion of my post !)
By the way: the movie seems to have been right: men have sacrificed for women.
Pingback: Would You Survive the Titanic? A Guide to Machine Learning in Python - CloudJocks
Pingback: Would You Survive the Titanic? A Guide to Machine Learning in Python – WebProfIT Consulting
tf_clf_dnn.score(X_test, y_test) giving me an error saying
AttributeError: ‘TensorFlowDNNClassifier’ object has no attribute ‘score’
You’re probably using a newer version of the tensorflow library. Try replacing “TensorFlowDNNClassifier” with “DNNClassifier”, and let us know if that fixes it.
Pingback: 14 Most popular August 2016 data science articles to read
Very impressive and useful functionality.
Nice tutorial, but unfortunately I cant get it to work because of a import error. This is what I get:
” from tensorflow.contrib import skflow
ImportError: cannot import name ‘skflow’ ”
Apparently it is because I’m on a Windows machine and when I Googled this problem most of the answers that I’ve get indicates to inform you about this problem.
Hey Hes, this tutorial was written using tensorflow version 0.8.0. Newer versions of TensorFlow have different import statements and names, which is what’s causing your error. The import command for the newest version of the library will look something like “import tensorflow.contrib.learn.python.learn as learn”.
Check out this Github issue for more help: https://github.com/tensorflow/tensorflow/issues/1931. You can also check out the updated documentation for TensorFlow Learn here: https://github.com/tensorflow/tensorflow/tree/master/tensorflow/contrib/learn/python/learn.
Thank you for your help, I already tried that. It seems that this tutorial cannot be finished on a Windows machine because of the changes and don’t really want to step over to a Linux/UNIX environment just for this tutorial. However, for future reference, this can be avoided if there is a disclaimer on top of this article.
@garcia First of all it is great tutorial for beginners and thanks to creator , i can not run the preprocessing part. (showing no attribute like lableencoder) i am using juypter launched using Anaconda, panda and numpy libraries are imported …….don’t able to import others.please help if anyone has solution.
Designer here. This was chock-full of information and you’ve done a great job documenting and presenting your thought process succinctly. Adding the stories of the exceptions at the end was also a nice touch . It was easy to follow even for someone with zero coding experience, i.e- me.
Thanks for the resources. Looking forward to trying this out.
Pingback: Data analytics knows if you are going to survive the sinking of Titanic | A4E Blog
@Hes
skflow it’s its own module so you should: import skflow. I’m on a Windows machine and it worked.
@Patrick
The paragraphs explaining your code are misplaced by one window: the mean of the survived is explained after the window with the mean for ‘pclass’ groupby.
Also when I start doing the TensorFlow (tf_clf_dnn), I get this error:
“AttributeError: module ‘tensorflow’ has no attribute ‘histogram_summary'”
which I wasn’t able to fix.
If anyone could point me in the right direction, it would be awesome.
Running TensorFlow 1.0.1 and Skflow 0.1 in Jupyter.
@Perianu
I try to fix part of problem about TensorFlow issue of Deep Neural Network finally success. But I’m still can’t set epoch, maybe you can following this:
# Deep Neural Network
feature_columns = tf.contrib.learn.infer_real_valued_columns_from_input(processed_df)
classifier = tf.contrib.learn.DNNClassifier(hidden_units=[10, 20, 10], n_classes=3, feature_columns=feature_columns, model_dir=”/tmp/my_model”)
classifier.fit(X_train, y_train, steps=300, batch_size=32)
survived_predictions = list(classifier.predict(X, as_iterable=True))
score = metrics.accuracy_score(y, survived_predictions)
print(“Accuracy: %f” % score)
Getting error in code blovk no 24
tf_clf_dnn = skflow.TensorFlowDNNClassifier(hidden_units=[20, 40, 20], n_classes=2, batch_size=256, steps=1000, learning_rate=0.05)
Traceback (most recent call last):
File “”, line 1, in
tf_clf_dnn = skflow.TensorFlowDNNClassifier(hidden_units=[20, 40, 20], n_classes=2, batch_size=256, steps=1000, learning_rate=0.05)
AttributeError: module ‘tensorflow.contrib.learn’ has no attribute ‘TensorFlowDNNClassifier’
just awesome, very crisp and clear info.
Great tutorial, but would love to see an update of skflow using tf.contrib.learn.DNNClassifier(). I haven’t used tensorflow but this would be a nice introduction if it works on my end. 😀
Very well done tutorial; thank you for sharing. I am coming up to speed in ML and am tackling this problem on Kaggle. Hope to do my first submission this month 😉
Accurate, but not explained well enough for beginners.
In newer versions, use:
” from tensorflow.contrib import learn as skflow”
and “model_selection” instead of cross_validation
I get an error while using DDNClassifier “TypeError: __init__() got an unexpected keyword argument ‘learning_rate'”, do you know where it comes from ?
This is an incredible article! I love how you created a story around the data, how the models works and the larger context of this disaster. The idea that you could perfectly predict survival from this data is ridiculous when you think about what actually happened, a point you very eloquently make. The additional analysis you did is something I’ll start doing to understand the context better and find logical limitations to modelling.
Pingback: Best data science tutorial for beginner – Trippyanalytics
Data is at the core of business intelligence. Business relies on data to provide insights into trends and thus come up with products or services that make them more competitive. Data analysis and intelligence derived from it can help make predictions about markets or manage production and employees too. Recently I have completed my Online Data Science Courses and get my certificates from simple Analytics Inc, with affordable course fees.