
Cross tabulation is a method to quantitatively analyze the relationship between multiple variables.
Also known as contingency tables or cross tabs, cross tabulation groups variables to understand the correlation between different variables. It also shows how correlations change from one variable grouping to another. It is usually used in statistical analysis to find patterns, trends, and probabilities within raw data.
When you can use cross tabulation
Cross tabulation is usually performed on categorical data — data that can be divided into mutually exclusive groups.
An example of categorical data is the region of sales for a product. Typically, region can be divided into categories such as geographic area (North, South, Northeast, West, etc) or state (Andhra Pradesh, Rajasthan, Bihar, etc). The important thing to remember about categorical data is that a categorical data point cannot belong to more than one category.
Cross tabulations are used to examine relationships within data that may not be readily apparent. Cross tabulation is especially useful for studying market research or survey responses. Cross tabulation of categorical data can be done with through tools such as SPSS, SAS, and Microsoft Excel.
An example of cross tabulation
“No other tool in Excel gives you the flexibility and analytical power of a pivot table.”
Bill Jalen
One simple way to do cross tabulations is Microsoft Excel’s pivot table feature. Pivot tables are a great way to search for patterns as they help in easily grouping raw data.
Consider the below sample data set in Excel. It displays details about commercial transactions for four product categories. Let’s use this data set to show cross tabulation in action.
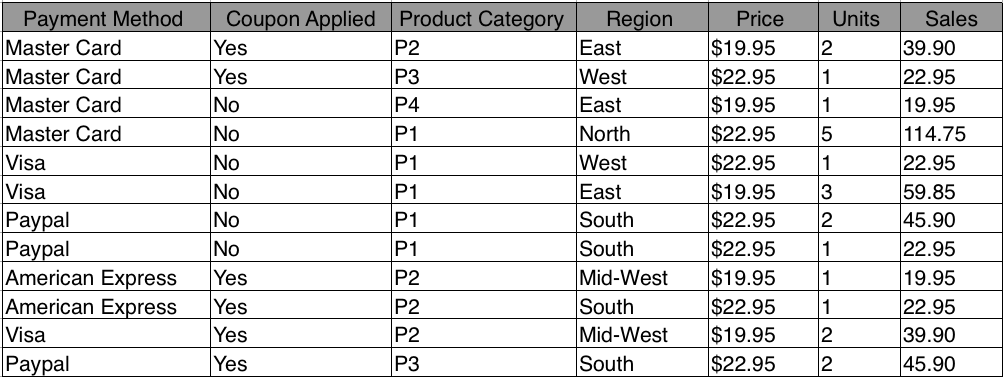
This data can be converted to pivot table format by selecting the entire table and inserting a pivot table in the Excel file. The table can correlate different variables row-wise, column-wise, or value-wise in either table format or chart format.
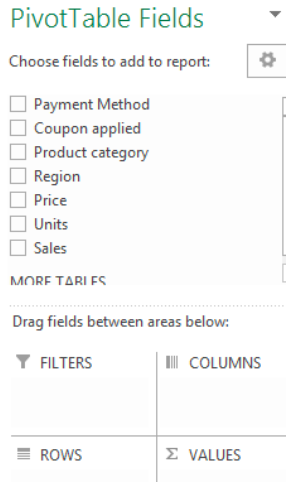
Let’s use cross tabulation to check the relation between the type of payment method (i.e. visa, MasterCard, PayPal, etc) and the product category with respect to the region of sales. We can select these three categories in the pivot table.
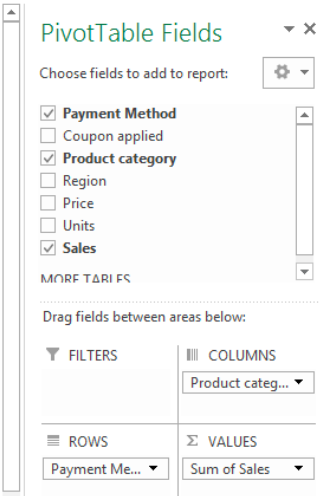
Then the results appear in a pivot table:
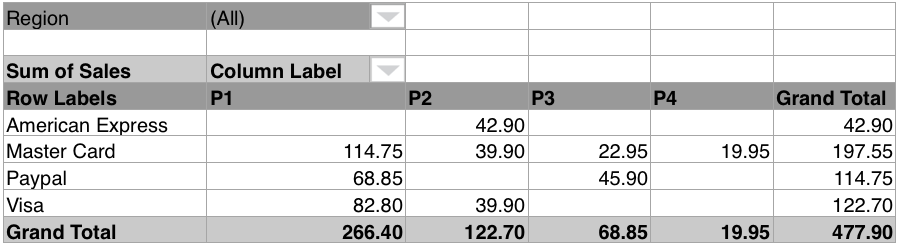
It is now clear that the highest sales were done for P1 using Master Card. Therefore, we can conclude that the MasterCard payment method and product P1 category is the most profitable combination.
Similarly, we can use cross tabulation and find the relation between the product category and the payment method type with regard to the number of transactions.
This can be done by grouping the payment method, product category, and units sold:
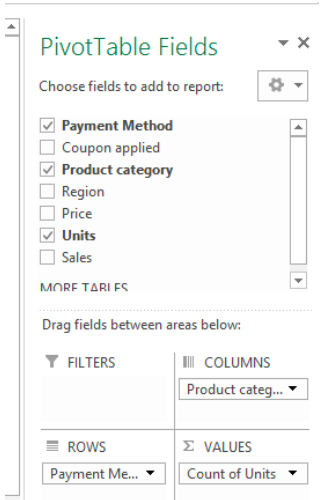
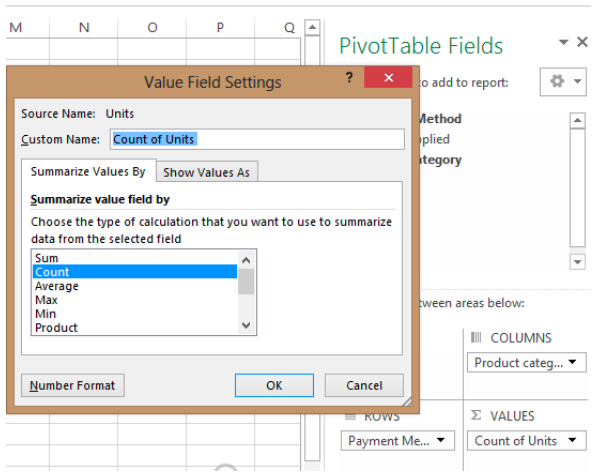
By default, Excel’s pivot table aggregates values as a sum. Summing the units will give us the total number of units sold. Since we want to compare the number of transactions instead of the number of units sold, we need to change the Value Field Setting from Sum to Count for Units.
The results of this pivot table mapping is as shown below. This is a cross tabulation analysis of 3 variables — it analyses the correlation between the payment method and payment category according to the number of transactions.
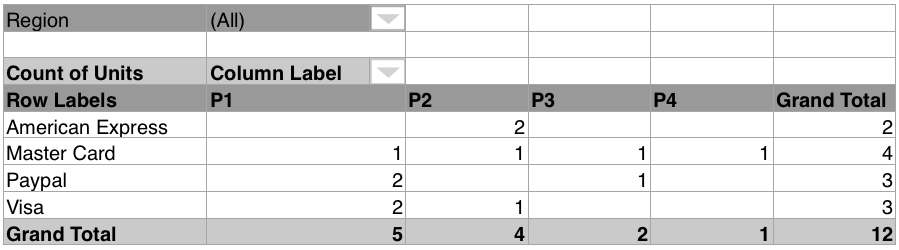
For all regions, we can observe that the highest selling category of products was P1 and the highest number of transactions was done using Master Card. We can also see the preferred payment method in each of the product categories. For example, American Express is the preferred card for P2 products.
The benefits of cross tabulation
Now that we are clear about how to use cross tabulation, let’s take a brief look at the benefits of using cross tabulation.
Eliminates confusion while interpreting data
Raw data can be difficult to interpret. Even for small data sets, it is all too easy to derive wrong results by just looking at the data. Cross tabulation offers a simple method of grouping variables, which minimizes the potential for confusion or error by providing clear results.
Helps in deriving innumerable insights
As we observed in our example, cross tabulation can help us derive great insights from raw data. These insights are not easy to see when the raw data is formatted as a table. Since cross tabulation clearly maps out relations between categorical variables, researchers can gain better and deeper insights — insights that otherwise would have been overlooked or would have taken a lot of time to decode from more complicated forms of statistical analysis.
Offers data points to chart out a course of action
Cross tabulation makes it easier to interpret data, which is beneficial for researchers who have limited knowledge of statistical analysis. With cross tabulation, people do not need statistical programming to correlate categorical variables. The clarity offered by cross tabulation helps professionals evaluate their current work and chart out future strategies.
Conclusion
Many studies suggest that cross tabulation is one of the most preferred methods of analysing market research or survey data. In fact, Qualtrics estimates that cross-tabulation analysis and single variable frequency analysis together account for more than 90% of all research analyses. So go ahead and use cross tabulation! It’s invaluable for uncovering hidden relationships in your raw data.
To see cross tabulation in action, check out the video version of this blog.
Photo by Mika Baumeister on Unsplash


4 Comments
Congratulations for your immense wealth of empowerment.
Am ready to welcome your contribution, thanks
Hello Amrutha. This is an excellent example of how to use the Excel Pivot table feature to analyze data. I would like to utilize this with my class and will give credit to you and this blog.
I did a survey on staff engagement. One of the questions was “I am an engaged employee.” All of the other questions pertained to the indicators of employee engagement. Would it be appropriate to cross-tabulate all of the questions with the question “I am an engaged employee” to determine the statistical significance of all of the questions?
Thanks for your insight!